04
Historical Context
Rebuild Limited Tickers With Custom Formulas
If a native ticker has limited history, use a custom formula to reconstruct it from components with deeper data.
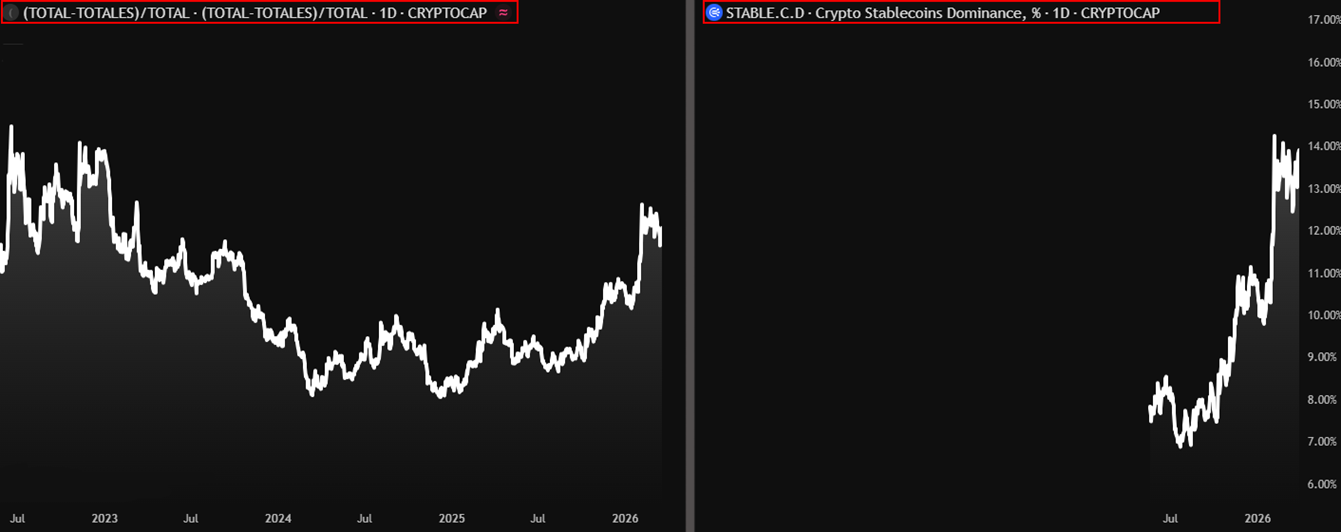
Some tickers on TradingView only have data going back to when they were listed, which makes drawing meaningful support, resistance, or trend lines almost impossible. A classic example is STABLE.D. If you pull that ticker right now, the data only goes back to mid-2025, so it can look like it’s sitting at all-time highs without any real context.
The fix is to use a custom formula in the TradingView search bar instead of the native ticker. TradingView lets you enter mathematical expressions directly, and if the underlying data exists for the components, you can reconstruct a metric that goes back much further.
For stablecoin dominance, type `(CRYPTOCAP:TOTAL – CRYPTOCAP:TOTALES) / CRYPTOCAP:TOTAL`. TOTAL is total crypto market cap and TOTALES is total market cap excluding stablecoins. The math is simple: total minus non-stable, divided by total, gives you stablecoin dominance.
How To Use It
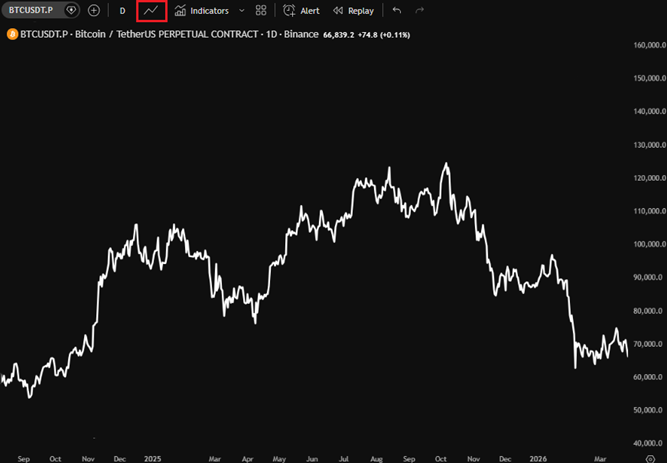
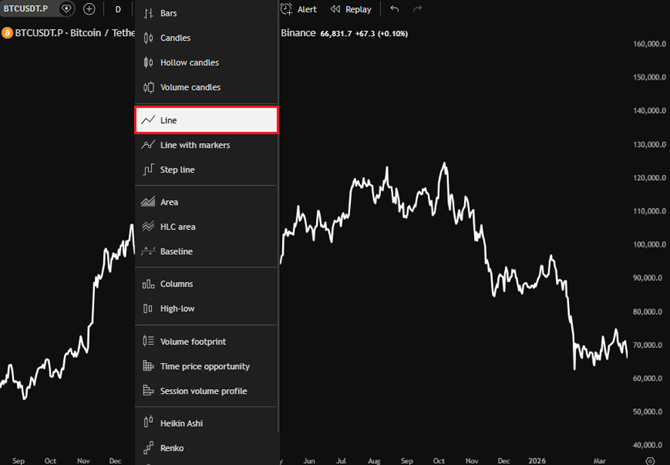
- Open TradingView symbol search instead of loading the native ticker directly.
- Paste the formula `(CRYPTOCAP:TOTAL – CRYPTOCAP:TOTALES) / CRYPTOCAP:TOTAL`.
- Load the formula as the active series and inspect the expanded history.
- Use the same approach for other sector and dominance metrics when native tickers are too new.
Foxian Read
Now you have real historical context instead of relying on a native ticker with a short data window.