
Most traders check individual coins. Smart traders check the indices first. These 15 TradingView metrics map the entire flow of capital through crypto from the broadest macro view all the way down to meme coins and DeFi. Here’s how to read every single one of them.
All of these are free TradingView tickers just type the symbol into the TradingView search bar and pull up the chart.
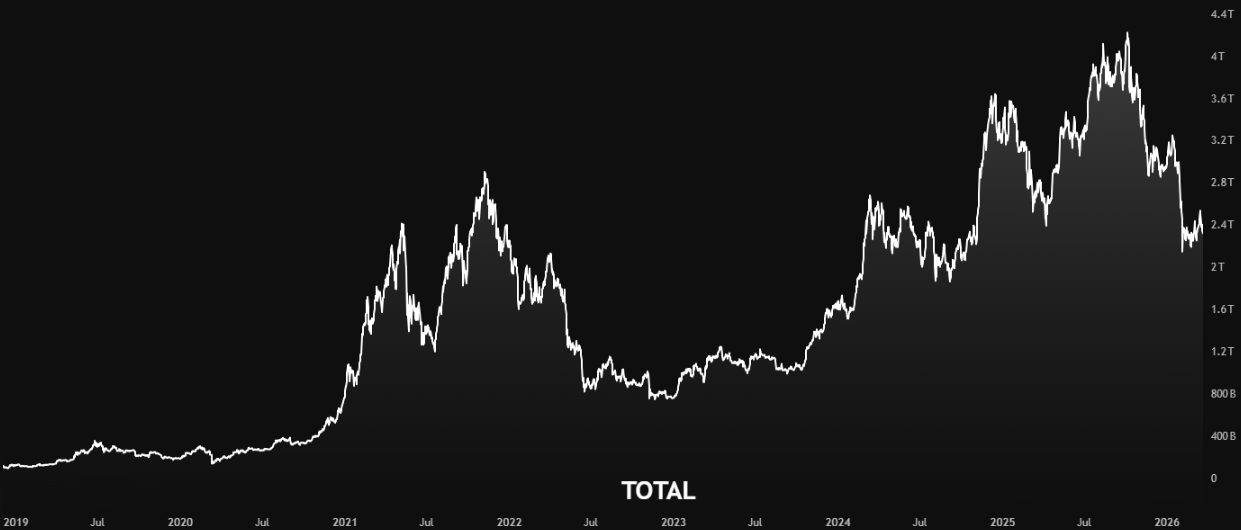
Total Crypto Market Capitalization
TOTAL is the starting point. It’s the single number that tells you how much capital is in crypto right now. When TOTAL is climbing, money is flowing into the market. When it’s dropping, money is leaving. What makes it useful is context. A rising TOTAL with a rising BTC.D means most of that new capital is going into Bitcoin. A rising TOTAL with a falling BTC.D means altcoins are absorbing the bulk of it. You can’t figure out where the money is going unless you first know whether money is coming in at all.
Traders watch TOTAL for macro-level support and resistance. If the total crypto market cap hits $2.5 trillion and gets rejected three times, that becomes a ceiling. Breaking through it means something fundamentally changed new institutional inflows, a regulatory catalyst.
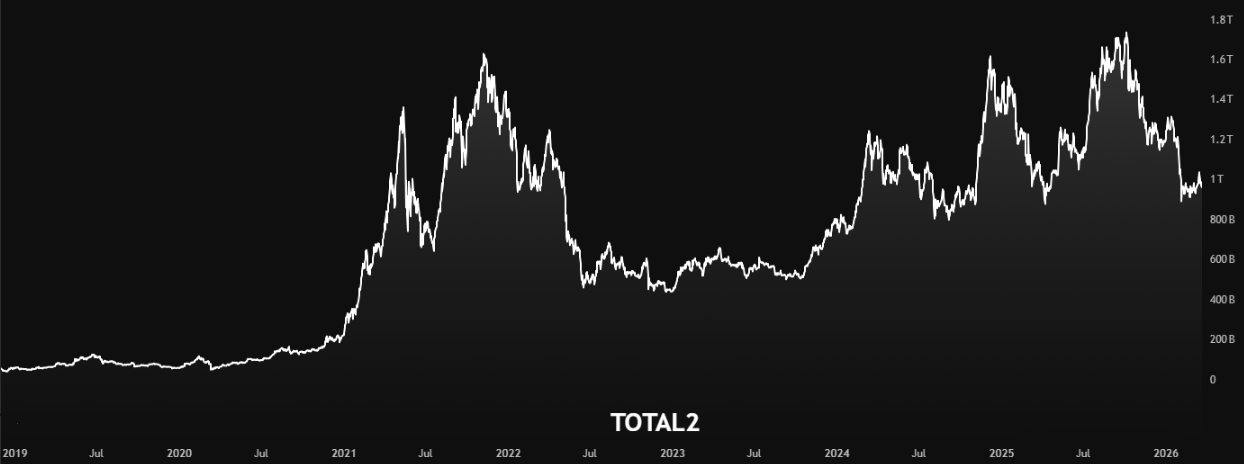
Total Crypto Market Cap Excluding Bitcoin
TOTAL2 strips Bitcoin out of the equation. What you’re left with is a pure read on how the rest of the market is performing. During early bull markets, Bitcoin usually leads. It pumps first, TOTAL rises, but TOTAL2 lags behind because altcoins haven’t caught up yet. Then at some point, capital rotates. That’s the altcoin rally taking hold.
The gap between TOTAL and TOTAL2 is essentially Bitcoin’s market cap. When that gap is widening, Bitcoin is outperforming. When it’s narrowing, altcoins are gaining relative ground.
Total Crypto Market Cap Excluding Bitcoin and Ethereum
TOTAL3 removes both Bitcoin and Ethereum, leaving you with everything else Solana, XRP, BNB, Cardano, meme coins, DeFi tokens, and the entire long tail. If TOTAL3 is rising faster than TOTAL2, capital is flowing down the risk curve into smaller tokens a sign of increased speculation and risk appetite.
TOTAL3 tends to be the last to pump in a cycle and the first to dump. It’s where the highest beta lives. When this chart goes vertical, the market is euphoric.
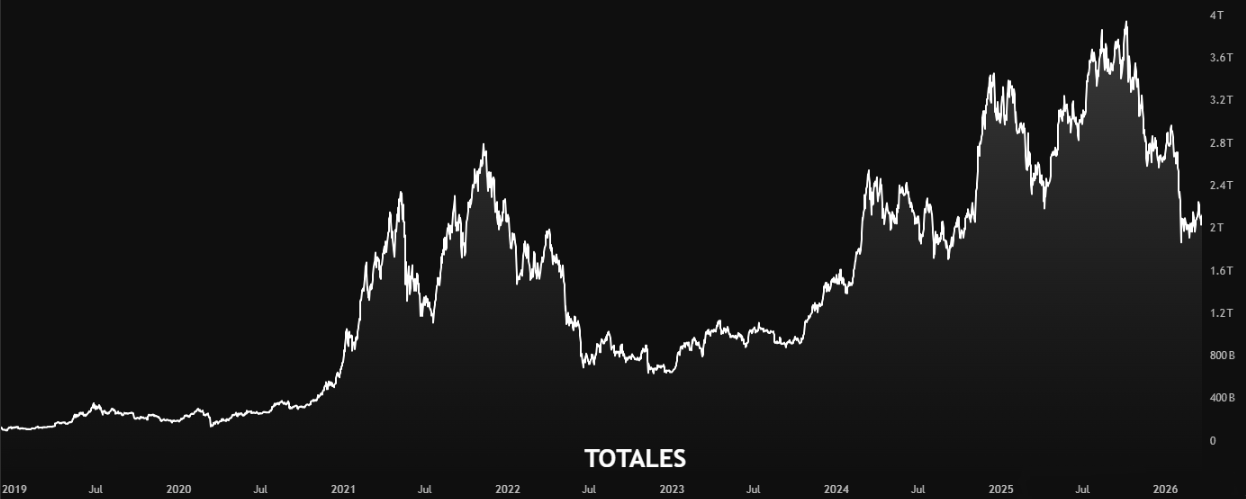
Total Crypto Market Cap Excluding Stablecoins
Stablecoins are parked money. TOTAL tells you how big the crypto pool is. TOTALES tells you how much of that pool is actually swimming. If TOTAL is flat but TOTALES is dropping, people are selling their positions and parking in stablecoins the market cap looks stable, but capital is actually rotating to safety.
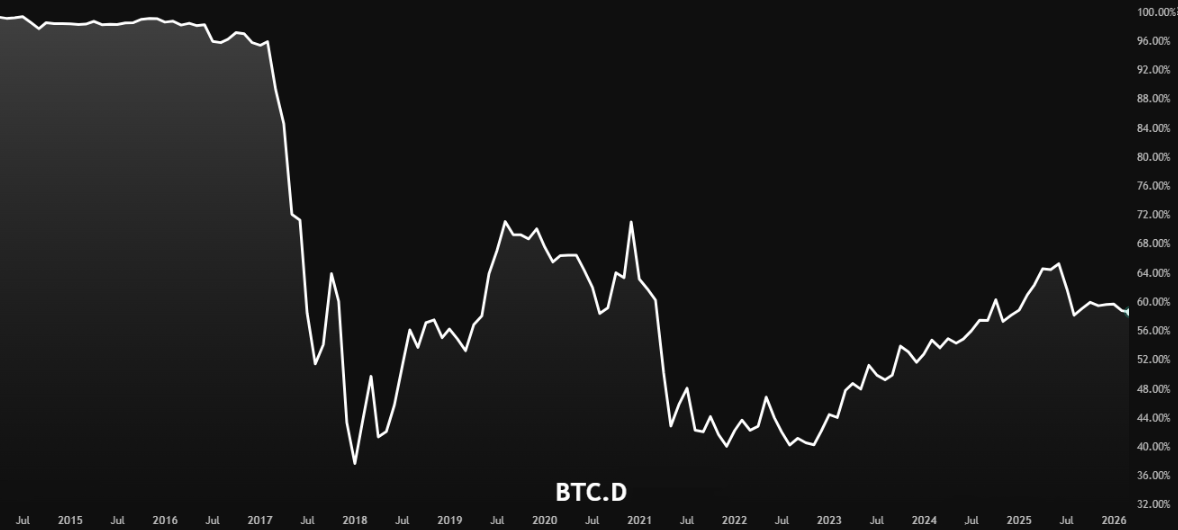
Bitcoin Dominance (BTC.D)
Bitcoin Dominance is the heartbeat of the crypto market. BTC.D = (Bitcoin Market Cap / Total Crypto Market Cap) x 100. When BTC.D rises, Bitcoin is outperforming. When BTC.D falls, altcoins are gaining ground the classic “altseason” signal.
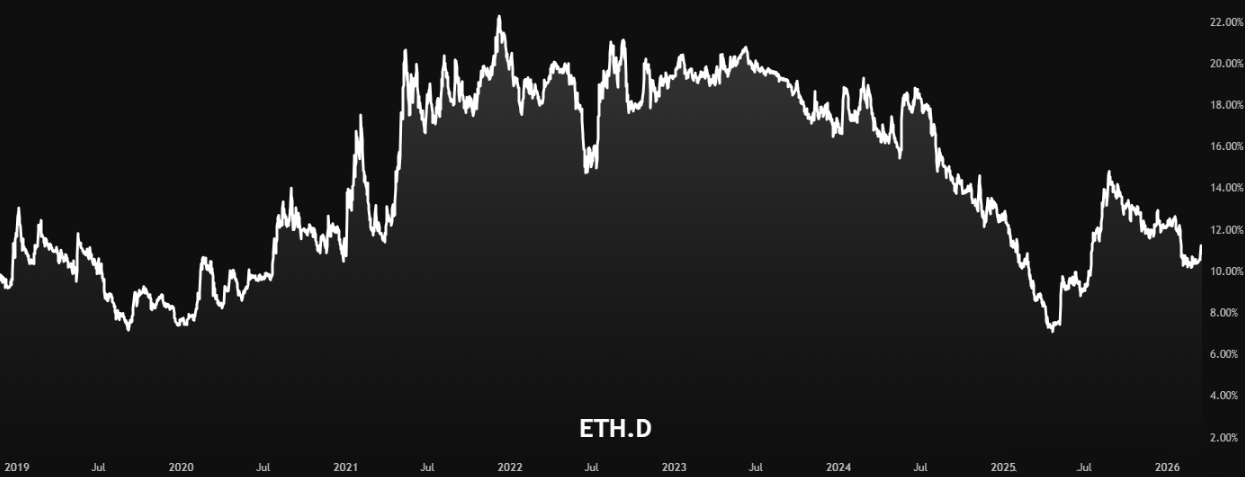
Ethereum Dominance (ETH.D)
ETH.D works exactly like BTC.D but for Ethereum. Watching ETH.D alongside BTC.D gives you a three-way split: Bitcoin’s share, Ethereum’s share, and everything else. When both BTC.D and ETH.D are falling, the rest of the market is gaining ground fast.
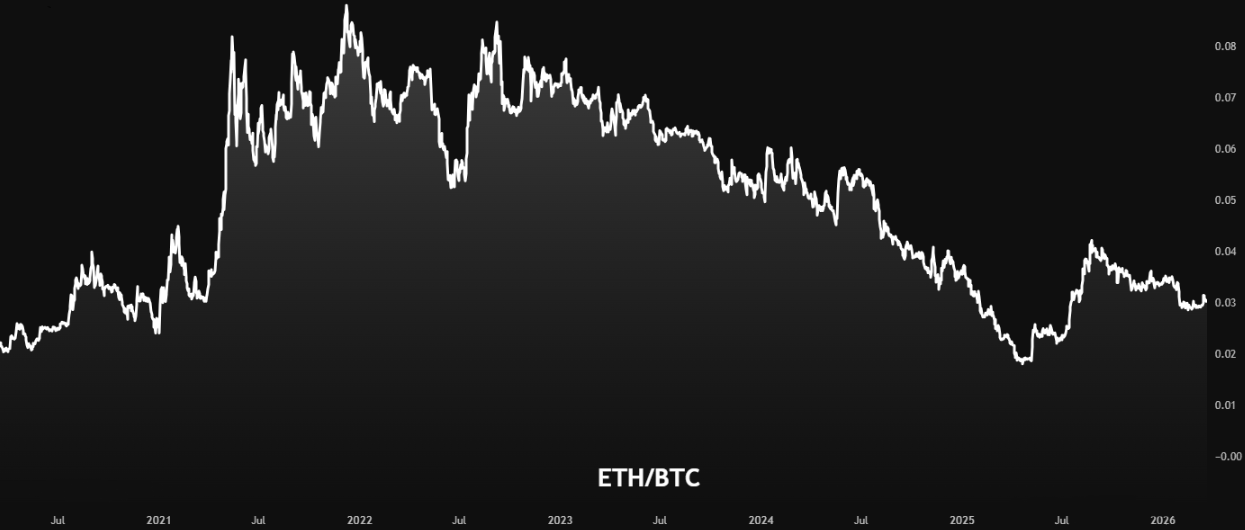
Ethereum vs. Bitcoin Ratio
The ETH/BTC trading pair. Widely considered the most important ratio chart in crypto.
A lot of traders call ETH/BTC the single most important chart in the entire crypto market. It tells you whether the market is in risk-on mode or risk-off mode. If ETH can’t outperform BTC, smaller alts usually have no chance.
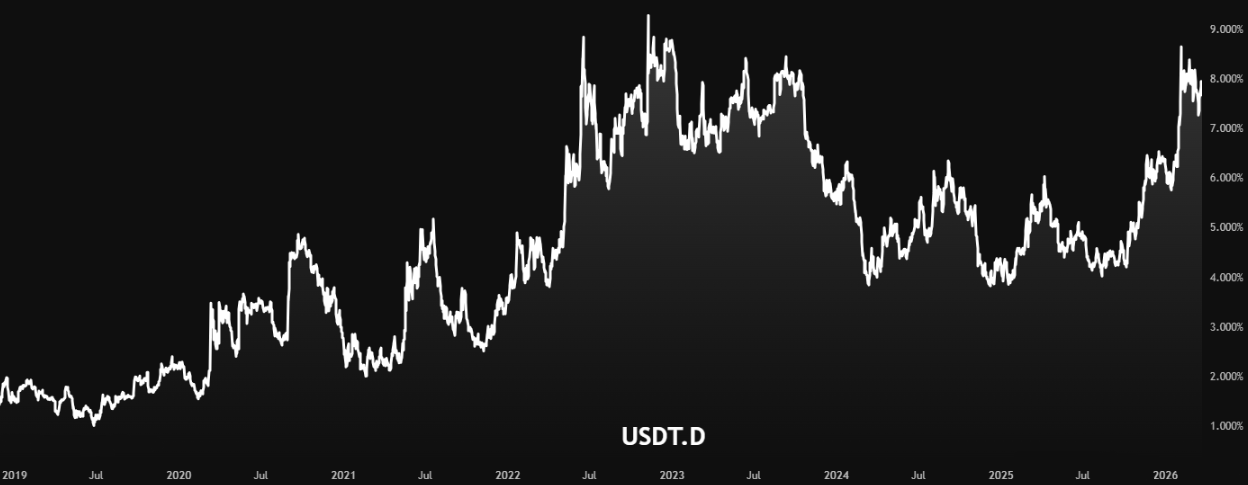
Tether Dominance
When USDT.D is rising, fear is winning. When USDT.D drops, confidence is returning traders are deploying that parked capital back into Bitcoin and altcoins. A breakdown in USDT.D is often one of the earliest signals that a rally is about to start.
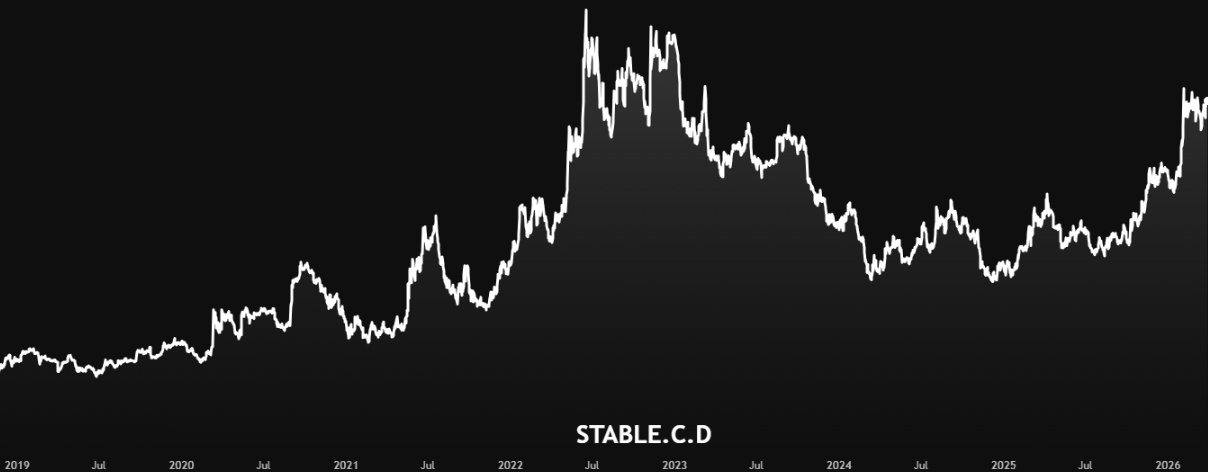
Stablecoin Dominance Aggregate (STABLE.C.D)
STABLE.C.D is the broader version of USDT.D. It catches flows that USDT.D alone might miss. If STABLE.C.D is falling but TOTAL is also falling, it doesn’t necessarily mean money is going into crypto it could mean people are exiting stablecoins to fiat entirely.
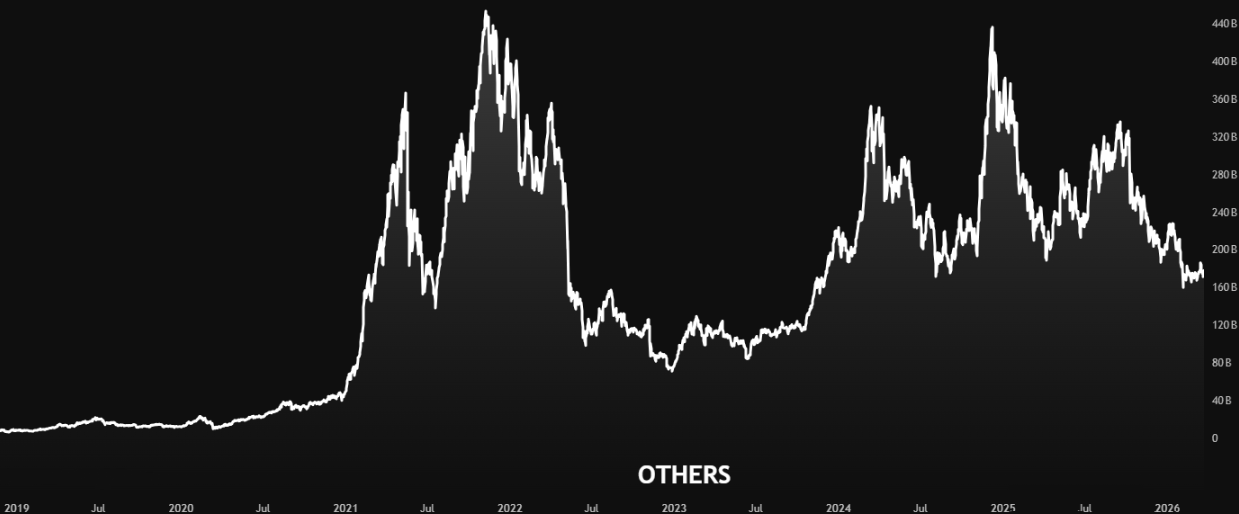
Total Market Cap Excluding Top 10 Coins
When OTHERS is pumping, traders are fully risk-on and hunting for the biggest percentage gains they can find. OTHERS is a good barometer for retail participation.
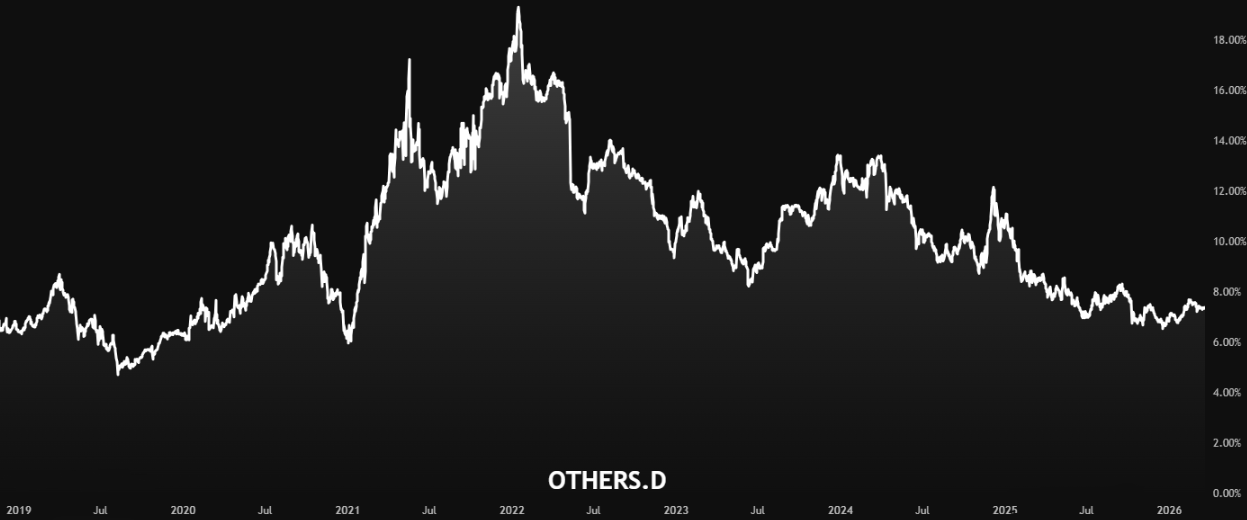
Others Dominance
The dominance of all cryptocurrencies outside the top 10, expressed as a percentage of the total market cap.
When OTHERS.D is rising, smaller coins are actually gaining ground relative to Bitcoin, Ethereum, and the rest of the top 10. During altseasons, OTHERS.D climbs as retail traders pour into smaller projects.
Others vs. Bitcoin Ratio
A sustained reversal in OTHERSBTC would be one of the strongest signals that a broad-based altseason is starting. Until that happens, it’s telling you that Bitcoin remains the dominant force.
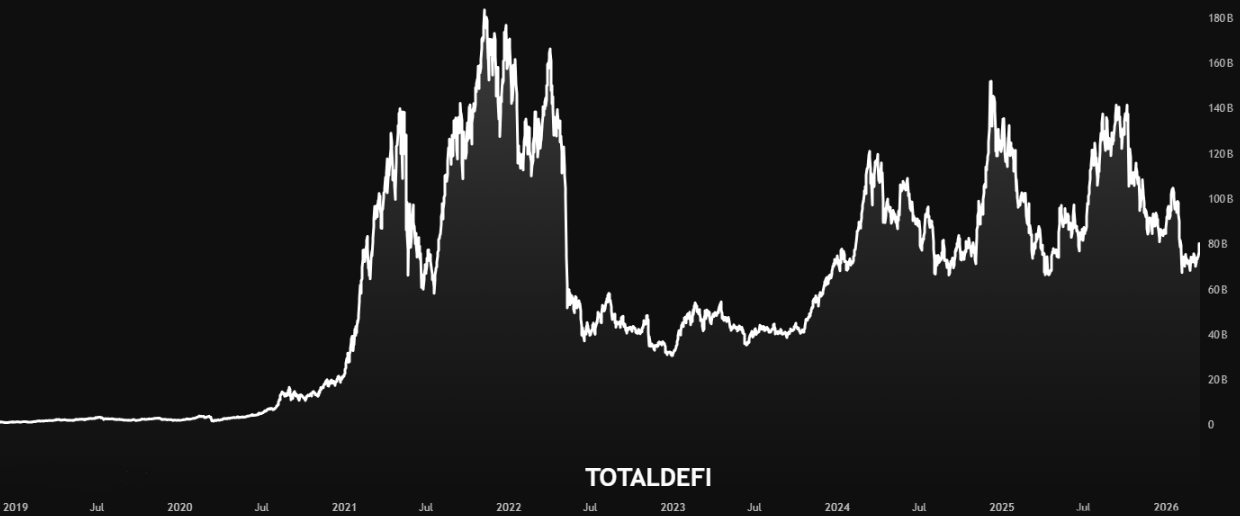
Total DeFi Market Capitalization
Comparing TOTALDEFI against TOTAL3 tells you whether DeFi is leading or lagging. If TOTALDEFI is outperforming TOTAL3, DeFi tokens are gaining relative strength.
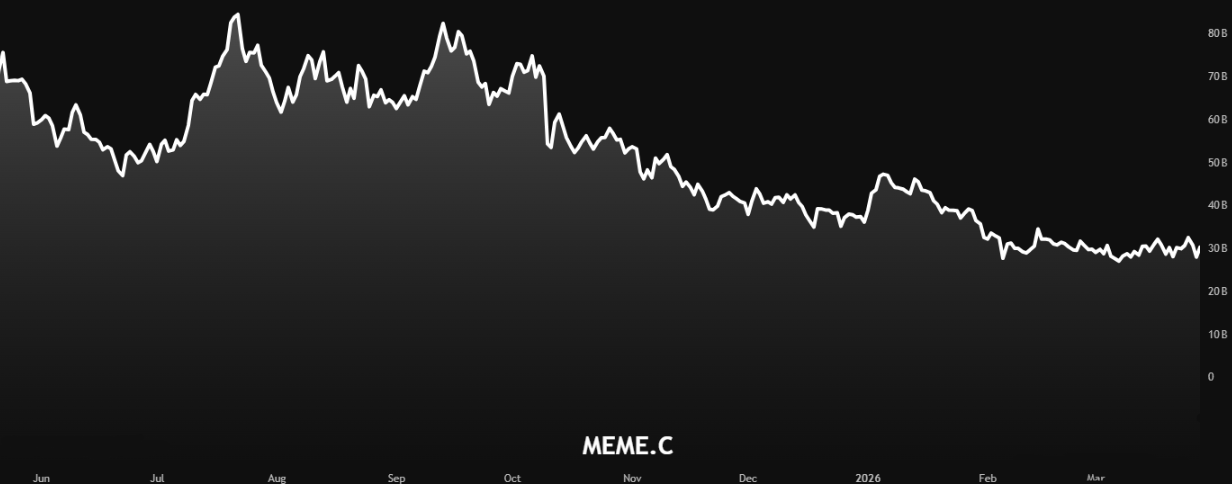
Meme Coin Market Capitalization
When MEME.C is pumping, retail is fully engaged, risk appetite is at maximum, and traders are chasing momentum regardless of fundamentals. MEME.C is a late-cycle indicator the last sector to rally and the first to collapse.
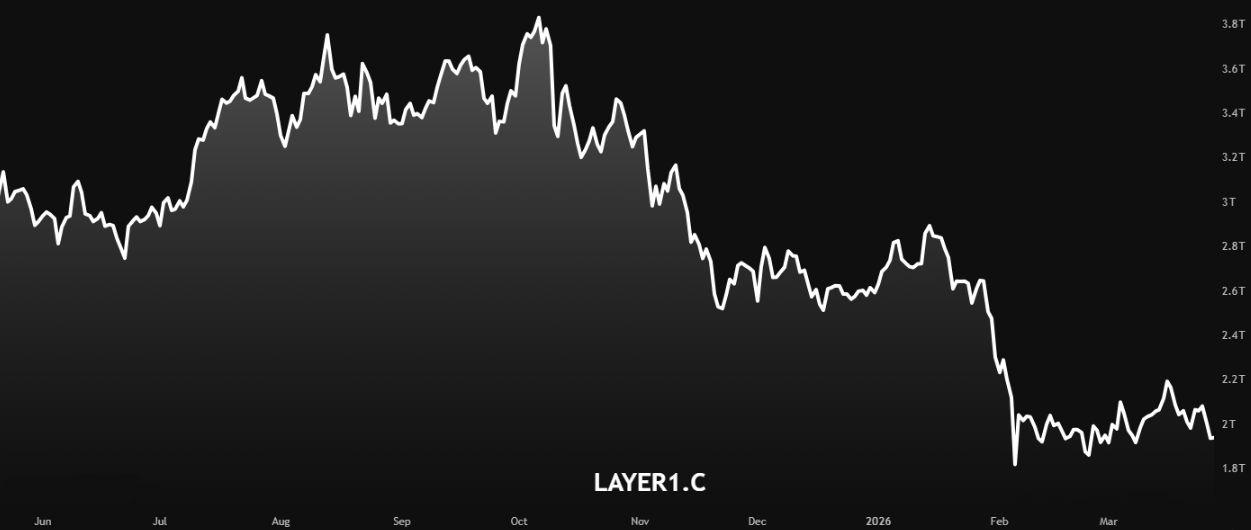
Layer 1 Blockchain Market Capitalization
When LAYER1.C is outperforming TOTAL3, investors are betting on ecosystem growth rather than individual apps.
Each of these indices tells you something on its own. But they’re most powerful when you read them together. Here’s the four-step process Foxian analysts use every day:
Start with TOTAL and TOTALES. Is money coming in or going out? Everything else only makes sense once you know whether the tide is coming in or going out. Don’t skip this step.
Check BTC.D, ETH.D, USDT.D, and STABLE.C.D. When both BTC.D and USDT.D are falling simultaneously, capital is moving out of safety and into altcoins.
Compare TOTAL2, TOTAL3, OTHERS, TOTALDEFI, MEME.C, and LAYER1.C. Whichever one is outperforming tells you exactly where the momentum is and which sectors to avoid.
Check ETH/BTC and OTHERSBTC for confirmation. A rising ETH/BTC often precedes altseason. If both ratios are falling, stay concentrated in BTC until they turn around.
⚠ Bearish Read
✦ Bullish Read
| Index | TradingView Ticker | Description |
|---|---|---|
| TOTAL | CRYPTOCAP:TOTAL | Total crypto market capitalization |
| TOTAL2 | CRYPTOCAP:TOTAL2 | Total market cap excluding Bitcoin |
| TOTAL3 | CRYPTOCAP:TOTAL3 | Total market cap excl. Bitcoin and Ethereum |
| TOTALES | CRYPTOCAP:TOTALES | Total market cap excluding stablecoins |
| BTC.D | CRYPTOCAP:BTC.D | Bitcoin dominance (% of total market cap) |
| ETH.D | CRYPTOCAP:ETH.D | Ethereum dominance (% of total market cap) |
| ETH/BTC | ETHBTC | Ethereum price relative to Bitcoin |
| USDT.D | CRYPTOCAP:USDT.D | Tether dominance inverse sentiment gauge |
| STABLE.C.D | CRYPTOCAP:STABLE.C.D | Aggregate stablecoin dominance |
| OTHERS | CRYPTOCAP:OTHERS | Market cap of coins ranked ~11th–125th |
| OTHERS.D | CRYPTOCAP:OTHERS.D | Dominance of coins outside the top 10 |
| OTHERSBTC | CRYPTOCAP:OTHERSBTC | Smaller altcoins vs. Bitcoin ratio |
| TOTALDEFI | CRYPTOCAP:TOTALDEFI | Total DeFi sector market capitalization |
| MEME.C | CRYPTOCAP:MEME.C | Meme coin sector market capitalization |
| LAYER1.C | CRYPTOCAP:LAYER1.C | Layer 1 blockchain market capitalization |